Understanding VheTM Reporting & Analytics: Dynamic Matrix Queries & Executive Dashboards
Explore how VheTM transforms operational data into multi-dimensional matrix reports, trainer capacity audits, and multi-campus executive dashboards.
End-to-End Execution Workflow
Select Operational Dimension & Date Window
Choose primary operational matrices: Lead Conversion Stages, Batch Fill Rates, Faculty Teaching Hours, or Center Financials.
Pivot Multi-Dimensional Cross-Sections
Cross-analyze metrics (e.g. Lead Source vs Course Category, Trainer Hours vs Branch Margin) dynamically without Excel.
Audit Outliers & Capacity Utilization
Identify under-enrolled batches, under-utilized instructors, and overdue fee installments before they impact bottom-line results.
Export Audit-Ready Reports or Schedule Digests
Generate executive PDF digests, Excel rollups, or automated periodic performance snapshots for management boards.
- 1. Native Matrix Reporting Architecture
- 2. How the Report Plus Matrix Engine Works
- 3. Trainer Capacity & Utilization Auditing
- 4. Multi-Campus Financial & Fee Rollups
- 5. Real-Time Executive KPI Dashboards
- 6. Summary & Analytics Takeaways
Want to see this in your environment?
Get Custom Pricing1. Native Matrix Reporting Architecture
Traditional educational ERPs store data in isolated silos: CRM data in one table, batch logs in another, and accounting records in a third system. Generating holistic insights requires extracting CSV files and manually reconciling columns in Excel.
VheTM connects all operational nodes—counselors, trainers, batches, students, invoices, and attendance logs—into a unified data layer, making multi-dimensional reporting instantaneous.
2. How the Report Plus Matrix Engine Works
The Report Plus engine allows administrators to pivot dynamic rows and columns on the fly. For instance, an executive can set Course Categories as rows and Inquiry Stages (New, Contacted, Counseling, Enrolled, Lost) as columns to immediately identify which courses have high drop-offs in the admissions funnel.
3. Trainer Capacity & Utilization Auditing
Faculty costs represent the largest operational expense for training providers. VheTM provides dedicated trainer workload audits comparing scheduled classroom teaching hours against weekly maximum thresholds. This prevents burnout and identifies idle capacity.
4. Multi-Campus Financial & Fee Rollups
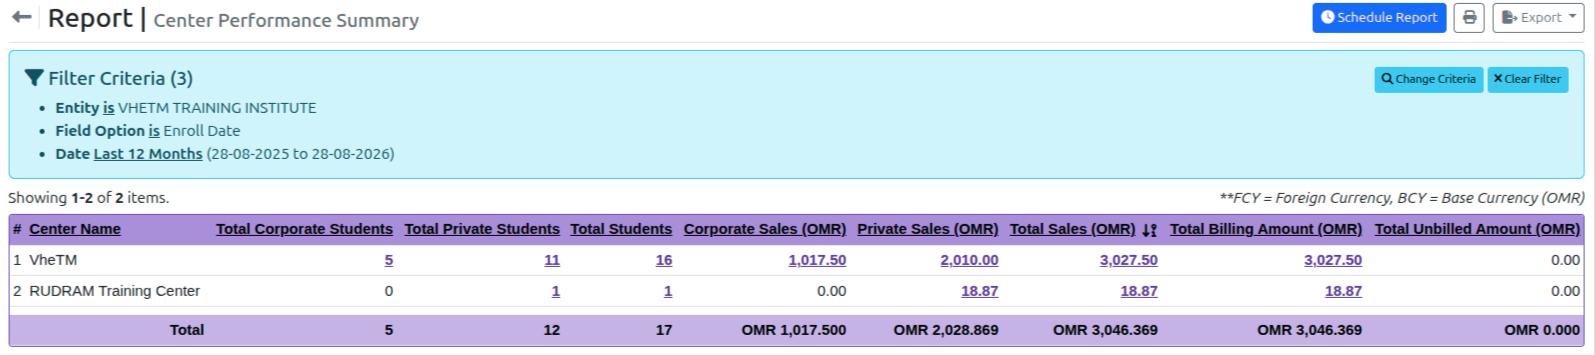
For multi-branch training networks, the Center Performance Summary aggregates gross tuition invoiced, collected receipts, outstanding installment aging, and center operational expenses across all locations on a single screen.
5. Real-Time Executive KPI Dashboards
Executive leadership monitors high-level health indicators—total active batch count, cohort attendance averages, enrollment conversion rates, and revenue collection velocity—with drill-down capabilities into specific branch batches.
Key Operational Takeaways
- Perform multi-dimensional matrix queries across courses, campuses, and counselors natively in VheTM.
- Audit trainer workload utilization to optimize faculty allocation and prevent burnout.
- Track multi-campus financial performance, fee collection velocity, and outstanding installments.
- Eliminate hours of manual spreadsheet compilation with real-time dynamic executive rollups.
VheTM Reporting & Analytics Engine
Explore the complete matrix reporting features, filters, and audit export capabilities.
Explore Reporting FeaturesSolutions for Skill Development Networks
Learn how vocational networks and multi-center academies monitor compliance and scale reporting.
View Skill Network SolutionsReady to Experience VheTM in Action?
Discover how VheTM coordinates training operations with admissions CRM, foolproof accounting, and multi-agent student messaging in one unified platform.