Complete Training Operations
Reporting & Analytics Software
Unify training operations, learner attendance, faculty workload, and revenue performance with out-of-the-box operational ledgers, dynamic Report Plus custom builders, and pipeline forecasting.
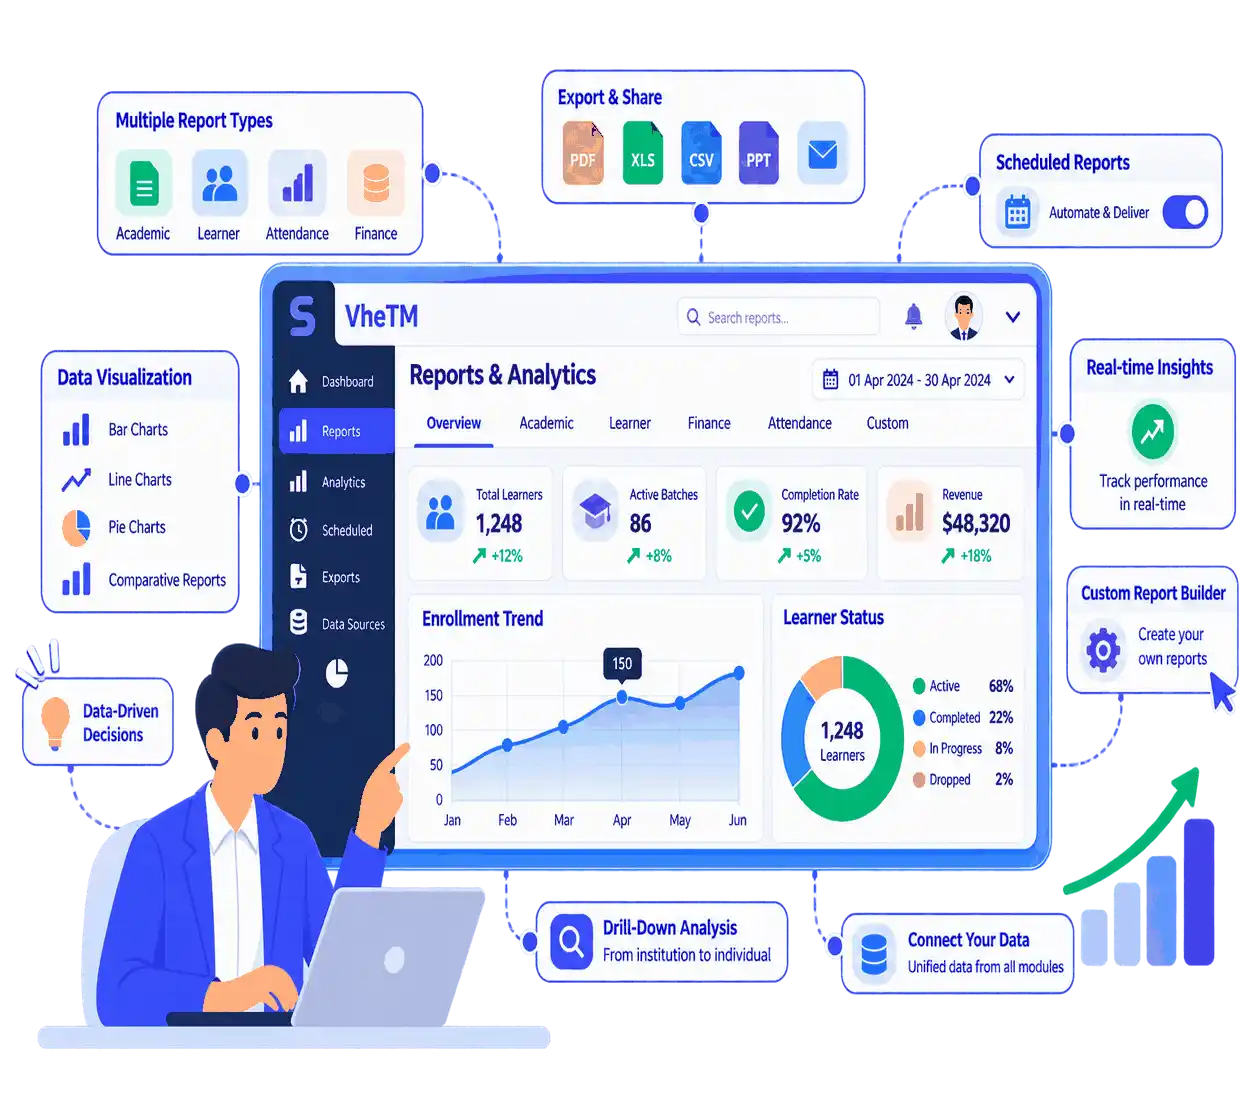
Turn Everyday Training Activity Into Actionable Operational Clarity
Training executives lose dozens of hours every month manually consolidating fragmented spreadsheets across centers, departments, and faculty schedules. When data lives in silos, spotting underutilized classrooms, identifying student attendance drops, or analyzing branch revenue takes days of manual effort.
VheTM unifies Reporting & Analytics directly on top of your central training operations database. Access dozens of instant prebuilt ledgers, build custom cross-functional matrix reports with the visual Report Plus engine, monitor multi-center utilization, and forecast intake targets with zero manual recalculations.
Predefined Reports
Instant operational reports for batches, attendance, faculty utilization, certificates, and exams.
Report Plus Builder
Build custom pivot reports with dynamic entity pickers, multi-level grouping, and filters.
Utilization Analytics
Analyze annual instructor teaching hours, room occupancy rates, and course department margins.
Pipeline Forecasting
Structured forecasting for targets vs. achievements, committed deals, and pipeline shortage.
Everything You Need to Analyze Training Operations
Explore the verified capabilities built into VheTM for generating operational ledgers, building custom pivot reports, and forecasting business growth.
Predefined Operational Reports
Deploy ready-to-use reports for student bookings, batch status matrices, weekly attendance logs, exam pass ratios, and certificate cycle times.
Dynamic Report Plus Builder
Select any ERP data object, configure custom column layouts, create multi-level groupings, and build advanced condition filters with ease.
Multi-Module Visual Dashboards
Monitor live operations through dedicated dashboards for Platform KPI overview, Batch schedules, CRM pipelines, and Activity tracking.
Faculty & Resource Utilization
Evaluate annual instructor teaching workloads, revenue generated per trainer, classroom occupancy percentages, and equipment asset health.
Pipeline Variance Forecasting
Structure intake targets and revenue forecasts by center, course, or sales user across monthly, quarterly, and annual periods with gap analytics.
Role-Based Sharing & Exports
Control report visibility by Private, User, Role, or Public access levels, and export any matrix or ledger directly to Excel, CSV, or PDF.
How Reporting & Analytics Operates in VheTM
From daily operational recording to automated aggregation, custom pivot creation, and executive exports.
Live Capture
Operational data streams automatically from batch schedules, registers, invoices, and certificates.
Report Selection
Choose from dozens of predefined ledgers or open Report Plus to build a custom query.
Filter & Group
Apply date ranges, center branches, course brands, and multi-level groupings.
Analyze & Share
Review live matrix data, evaluate pipeline variances, and save shared report views by role.
Export & Deliver
Export clean Excel, CSV, or PDF summaries for management meetings and sponsor audits.
Dynamic Pivot Matrices & Pipeline Analysis
Inspect cross-tabulated matrix reports, evaluate stage-by-stage conversions, and export operational datasets.
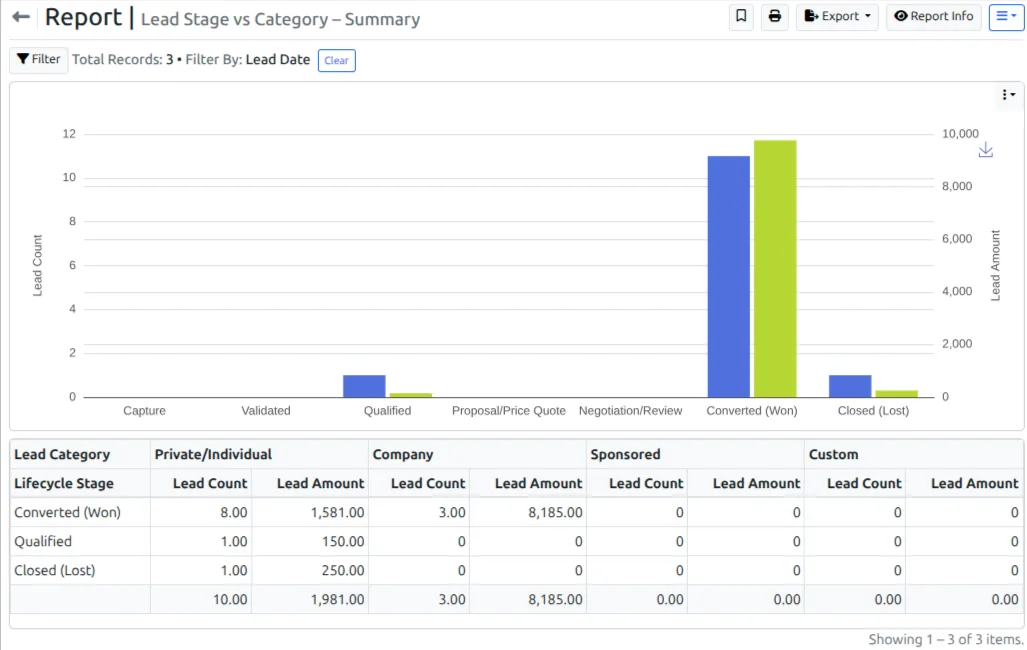
Cross-Functional Pivot Matrices on Demand
Stop writing complex spreadsheet lookup formulas. VheTM’s Report Plus engine aggregates multi-dimensional datasets instantly, allowing coordinators and leadership to slice data by intake category, branch, and lifecycle stage.
Why Training Organizations Choose VheTM
Engineered specifically for the real-world operational challenges of consolidating training metrics, monitoring resource utilization, and driving growth.
Single Source of Truth
Eliminate conflicting spreadsheets by querying live data directly from your unified training database.
Report Plus Power
Build tailored matrix reports in minutes without requiring technical database administrators.
Capacity Optimization
Identify underutilized classrooms and faculty teaching hours to maximize operational margins.
Audit-Ready Compliance
Generate verified attendance ledgers and certificate processing logs for regulatory audits.
Tailored for Real-World Training Analytics Workflows
Explore how different training organizations use VheTM to monitor operational metrics, track intake performance, and drive efficiency.
Multi-Center Commercial Institutes
Compare revenue generation across branches, analyze trainer teaching hours, and forecast monthly intake targets vs. committed revenue.
- Center performance comparison
- Sales forecasting & gap analysis
Corporate L&D Academies
Deliver verified employee attendance reports, measure cohort assessment pass ratios, and track client contract seat fulfillment.
- Corporate client performance ledgers
- Cohort exam pass ratio analytics
Vocational & Accredited Centers
Track certificate attestation processing timelines, identify ministry submission delays, and monitor room occupancy compliance.
- Certificate processing cycle times
- Annual classroom occupancy reports
Move Beyond Disconnected Spreadsheets and Manual Report Assembly
See how VheTM’s unified training operations ERP transforms reporting and analytics.
| Operational Capability | Disconnected Spreadsheets | VheTM Unified Reporting ERP |
|---|---|---|
| Report Generation | Days spent exporting CSVs and manually merging tabs in Excel | Instant prebuilt ledgers and live dynamic Report Plus queries |
| Custom Pivot Builder | Vulnerable pivot tables prone to broken references and formula errors | Native visual Report Plus builder with multi-level grouping & filters |
| Resource Analytics | No centralized visibility into annual trainer hours or room occupancy | Preconfigured trainer utilization and room capacity occupancy reports |
| Intake Forecasting | Unstructured guesses with no link to active deal stages | Structured forecasting tracking committed deals, targets, and gaps |
| Security & Permissions | Spreadsheets emailed insecurely with unmanaged access | Granular role-based sharing: Private, User, Role, or Public |
Part of the Unified VheTM Platform
Reporting & Analytics operates directly on top of VheTM’s relational training database—instantly synchronizing batch timetables, attendance scores, invoices, and certificate stages without third-party ETL connectors.
Common Questions About Reporting & Analytics
Clear answers about predefined ledgers, dynamic Report Plus queries, pipeline forecasting, and export capabilities.
VheTM includes comprehensive predefined reports covering Trainee Bookings, Sales by Course Department, Batch Status Summaries, Weekly & Monthly Attendance Matrices, Trainer Utilization & Workload, Cohort Exam Pass Ratios, Certificate Attestation Processing Times, and CRM Activity Trends.
Report Plus allows administrators to create customized reports by selecting any ERP data entity (e.g. Batches, Trainees, Deals, Invoices, Certificates), choosing specific display columns, configuring multi-level groupings, and applying advanced boolean filters.
VheTM provides structured pipeline forecasting grouped by center, course, salesperson, or corporate account across monthly, quarterly, and annual periods—tracking Target, Achievement, Gap %, Committed, Best Case, and Pipeline Shortage.
Yes. Any report or matrix view can be exported directly to Excel (.xlsx), CSV, or PDF. Custom saved reports can be shared privately (own only), with specific users, with defined security roles, or made available publicly across the organization.
Take Control of Your Training Operations Intelligence
See how VheTM helps training providers eliminate manual spreadsheets, build custom Report Plus queries, and optimize resource utilization.