10 Training KPIs Every Organization Should Track
Measuring training effectiveness requires more than tracking final exam pass rates. Discover the 10 essential operational, financial, and delivery KPIs that drive institutional success.
- 1. Why Operational Metrics Matter
- 2. Operational & Capacity KPIs
- 3. Delivery, Attendance & Compliance KPIs
- 4. Commercial & Financial Velocity KPIs
- 5. Building Multi-Dimensional Matrix Dashboards
- 6. Summary & Metrics Governance
- • Key Takeaways
Need a custom training operations platform?
Get Custom Pricing1. Why Operational Metrics Matter
Many training institutions only look at top-line revenue or end-of-year student counts. However, profitability and student retention depend on operational efficiency throughout the batch lifecycle.
Tracking granular operational KPIs allows leadership to identify underutilized trainers, spot batch capacity bottlenecks early, and optimize resource allocation.
2. Operational & Capacity KPIs
Key capacity metrics include:
- Batch Fill Rate (%): Percentage of available classroom or cohort seats filled before course launch (target: ≥85%).
- Faculty Capacity Utilization: Active classroom teaching hours per instructor compared to contracted weekly maximums.
- Classroom / Lab Seating Occupancy: Efficiency of physical room utilization across morning, afternoon, and evening slots.
3. Delivery, Attendance & Compliance KPIs
Key academic and delivery metrics include:
- Cohort Attendance Average (%): Real-time aggregate session attendance across all enrolled learners.
- Assessment Pass Rate (%): First-time pass rates across theory, practical, and viva scoring components.
- Course Graduation Velocity: Percentage of trainees who graduate on time without extending batch timelines.
4. Commercial & Financial Velocity KPIs
Key financial metrics include:
- Inquiry-to-Enrollment Conversion Rate: Counselor pipeline conversion percentage by lead source and course category.
- Fee Collection Velocity: Percentage of due installment milestones collected on or before the due date.
- Revenue per Trainer Hour: Net tuition generated per instructional hour delivered.
- Branch Profitability Index: Net operational margin per campus location after faculty and facility costs.
5. Building Multi-Dimensional Matrix Dashboards
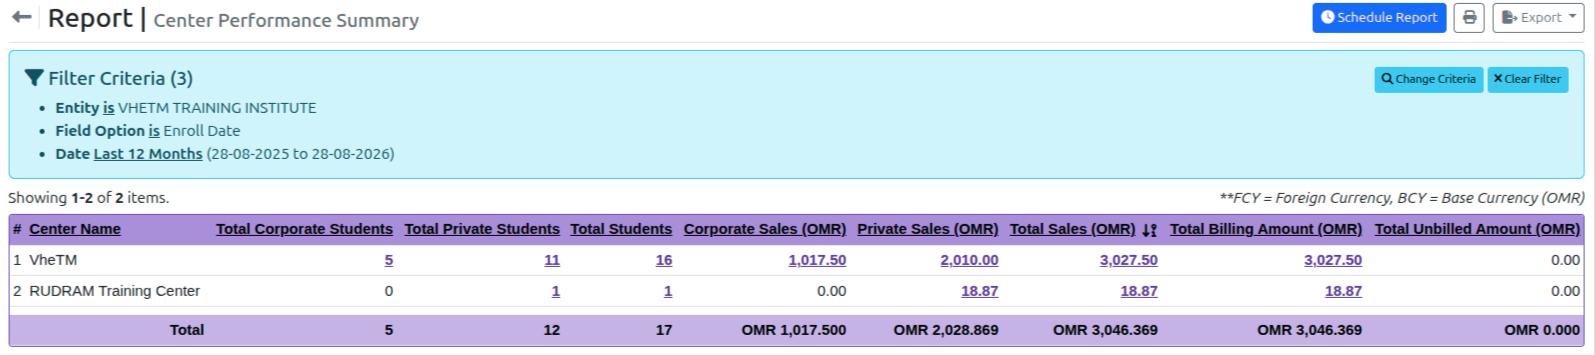
Rather than compiling static monthly Excel reports, high-performing institutes use dynamic matrix analytics engines (such as VheTM Report Plus) to pivot lead stages against course categories, trainer utilization against batch statuses, and branch performance in real time.
6. Summary & Metrics Governance
Establishing a data-driven culture with weekly KPI reviews transforms operational bottlenecks into growth opportunities.
Key Takeaways
- Track trainer capacity utilization to prevent faculty over-allocation or idle hours.
- Monitor batch fill rates to optimize minimum enrollment break-even points.
- Measure fee collection velocity in real time to avoid cashflow bottlenecks.
- Leverage multi-dimensional matrix reports for instant executive visibility across campuses.
VheTM Reports & Matrix Analytics Engine
Generate multi-dimensional lead stage vs course matrices, trainer utilization audits, and center financial performance rollups.
Explore Reporting & AnalyticsReady to Improve Your Training Operations?
Explore how VheTM helps training institutes, colleges, universities, and corporate L&D teams manage courses, learners, attendance, assessments, certifications, reporting, and communication in one unified platform.